The data was collected from mode analytics. It shows the crimes reported to San Francisco Police Department from Nov 1 2013 to Jan 31st 2014. For every crime that was reported the data includes:
- The type of crime
- When and where was the crime reported
- How it was resolved.
When I was looking for interesting trends in the data I chanced upon two curious facts.
- Most of the petty larceny that is committed in SF peaks during the hours of 4 pm and 7 pm. I would have expected this peak to appear a little later in the day maybe after 9 pm. One possible theory to explain this is that during the months of November and January, daylight fades pretty quickly during this time of the day, and it is also the time that most of the office crowd in on the streets returning home. This could be why the petty larceny rate isn’t as high as during 8 am to 10 am which is also the commuting hour.
- Christmas seems to have an uplifting effect on the criminal class. There is a marked reduction in crime in the week leading up to christmas. And almost as if to make up for it they (the criminals) begin the new year with increased vigor. So given below are a few of the trends that I pulled out from the data. My conclusions below might be completely erroneous since all I have is three months worth of data. But statistics pulls out confident results with less :)
Christmas
Let me prove my point about Christmas first. First, here is a graph showing the number of reported incidents of each kind of crime in San Francisco on 25th November, 25th December and 25th January.
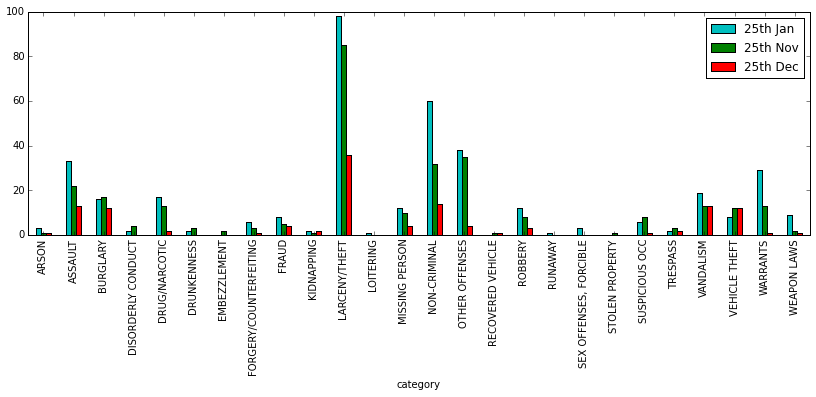
This shows that number of reported incidents on November and January are close by while December shows a marked reduction.
Now let’s see how crime resolution changes.

Can’t really conclude anything from this since crime is low on Christmas anyway. Now let’s look at number of crimes committed each week.

Week 44 and Week 5 are the extremes ends of this dataset and as such they may not contain all the data that they could have. So looking at this the week of christmas is still the week with lowest incidents of reported crime.
Let’s look at the crime wave between Dec 23nd and Dec 29th i.e. the week of christmas
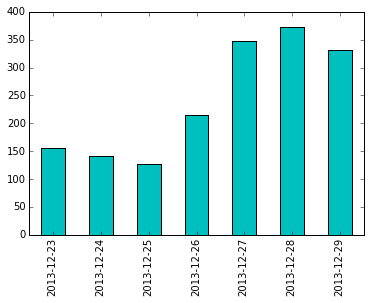
I have pulled at the data from every possible thread and this seems to clinch it. On the days leading to Christmas even criminals feel the effect of the Holy Spirit, they however quickly swing back to action after two days.
Most crime ridden time of the day
During a 24 hour period when is the most crime reported to have occured?

Perhaps number of crimes committed is directly proportional to the number of people who are out on the street. Add to that the hour between 4pm to 7pm is when sunlight diminishes. Maybe that has an effect? Let’s see the distribution of petty larceny during the day
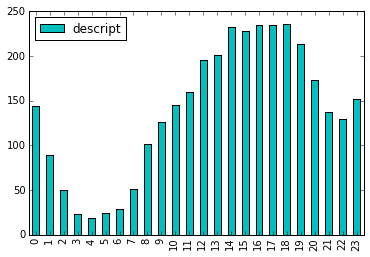
The wee hours of the morning are going to be the quietest since there are so few people on the streets to rob.
Car thefts
San Franciso also reports a lot of stolen car cases. Now let’s look at the distribution of stolen cars based on the time of the day.

The data seems to suggest that most cars are stolen when people of SF are out having dinner. This could be substantiated by identifying the regions where cars get stolen the most. Plotting these locations on a map would be the best way to verify that.
a
a
a
a
a
a
a
a
a
a
a
a
Looks like it is mostly true. Downtown San Francisco seems to report the most number of stolen cars. The least coming from South of Golden Gate park which is almost entirely residential with very few restaurants.
How effective is SFPD in resolving crime
Before we ask this question however, it’s worthwhile to look at what kind of crime plagues San Francisco the most.
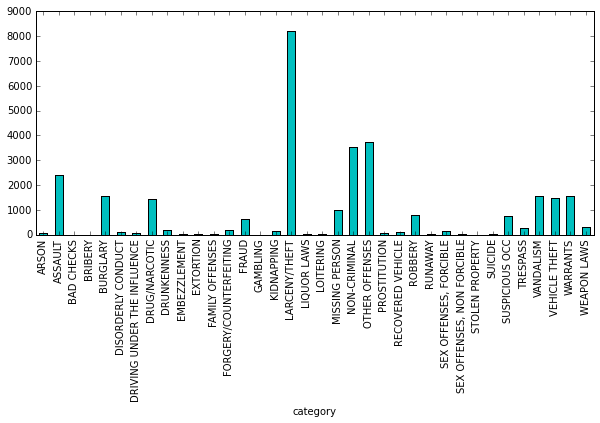
Larceny which takes into account all sorts of petty as well as grand thefts is what plagues SF the most. So effective is SFPD in resolving them?

So a staggering amount of the complaints that SFPD recieves goes unresolved. Let’s look at the next section to see what kind of crime the SFPD fails to resolve the most.
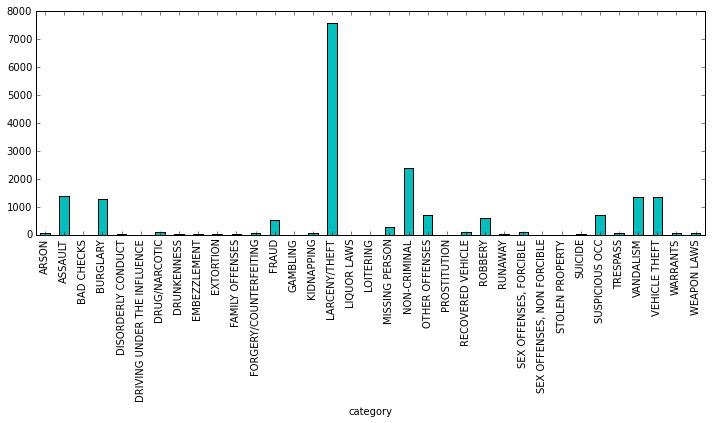
What if we instead asked which police district is most crime ridden? SF has 10 police districts. Let’s now see what the distribution of crime is among those districts.
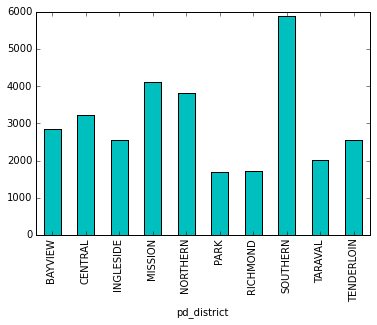
Let’s dig a little deeper into the distribution of crimes in these districts. Let’s compare the distribution of crime between the most crime ridden and least crime ridden district.
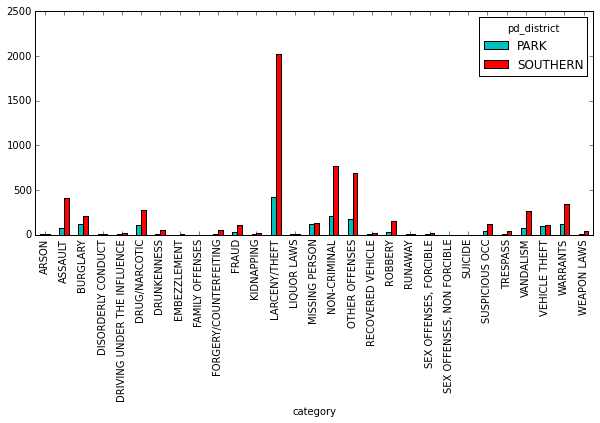
The park district seems to be a much better place to live in by all accounts.
What can we do with this information ?
I’ll be the first to admit the size of this data is very small. If i had this data for say five years, then I could establish a pattern and make suggestions. However given what we have and hoping this pattern repeats in more data here is what could be done:
- Let the SFPD relax during Christmas
- Deploy more police in the downtown area during the evening commute time, this should help reduce the number of petty larcenies as well as car thefts